Benchmark

Introduction

Client and server are directly connected through a CAT6 cable on a dedicated gigabit interface.
The idea is to count how many packets the server can handle while minimising the "external" factors. Therefore, no switch or other hardware is placed between the sender and receiver.

Details of the test

  • Sender sends queries from a pcap file using tcpreplay at various speeds
  • Queries are mostly www.*.eu A queries (most likely NXDOMAIN or NS delegation answer)
  • No DNSSEC

Machine specifications

Sender

  • Server: HP ProLiant DL160 G5
  • CPU: 2x Quad core (Intel(R) Xeon(R) CPU E5405 @ 2.00GHz)
  • Memory: 4x 4GiB DDR2 (FB-DIMM DDR2 FB-DIMM Synchronous 667 MHz (1.5 ns))
  • NIC: Broadcom Corporation NetXtreme BCM5722 Gigabit Ethernet PCI Express
  • OS: Ubuntu 12.04 kernel 3.2.0 (minimal server install)

Receiver

  • Server: Supermicro X8DTU
  • CPU: 2x Quad core HT enabled (Intel(R) Xeon(R) CPU L5630 @ 2.13GHz)
  • Memory: 6x 8GiB (DIMM DDR-3-1333 1066 MHz (0.9 ns))
  • NIC: Intel Corporation 82576 Gigabit Network Connection
  • OS: Ubuntu 12.04 minimal server install or FreeBSD 8.2

Procedure

A single pcap file with 6 000 000 UDP DNS query packets was created. We used tcpreplay on the client to send a number of packets to the server at a predefined rate. We calculated the reply rate by multiplying the reply ratio (answers recieved/queries sent) with the send rate. E.g. a send ratio of 100Kqps (100 000 queries per second) and a reply ratio of 80% would result in 80Kaps (80 000 answers per second).

The candidates

Here you can find the results of the benchmark tests between four different DNS implementations:

  • Yadifa-1.0.0
  • Nsd-3.2.10
  • Knot-1.0.5
  • Bind-9.9.1

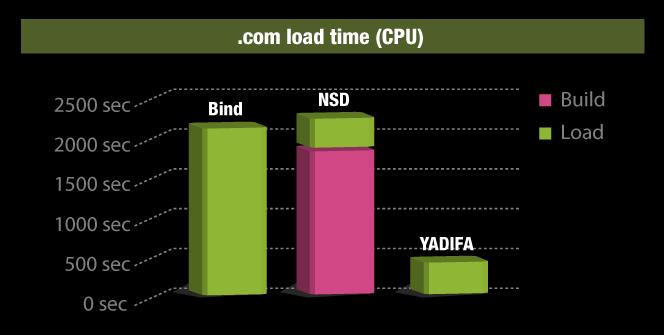
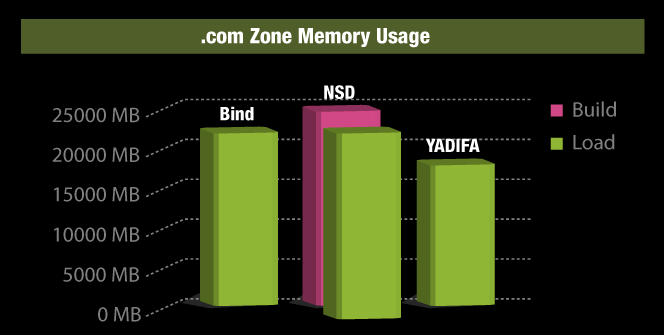
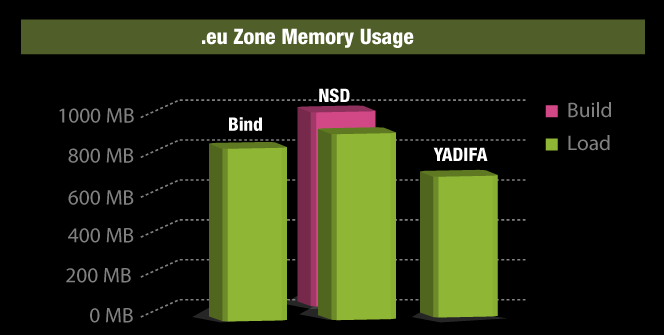
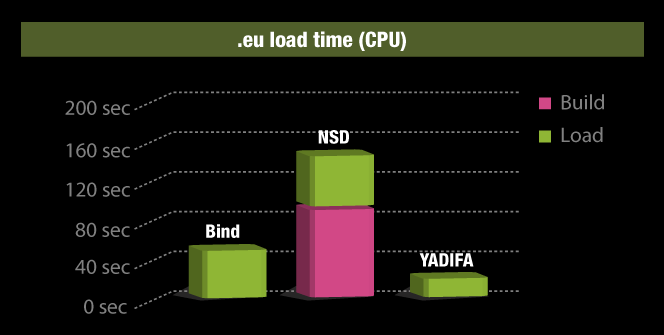
These four bar charts show the CPU load time and the zone memory usage for YADIFA, Bind and NSD.
The CPU load time graphs show the time the CPU needs to load the .eu and .com zones. Memory usage refers to the amount of RAM used once the zone has been fully loaded. The build time is the time required to compile the zone file for NSD.


The graphs below show the query rate on the x-axis and the answer rate on the y-axis.

Click on an individual test to enable/disable the graph.

Query ratesSetup: Ubuntu 12.04 using kernel 3.4.0 (Best results comparison)yadifa100-W0yadifa100-W1yadifa100-W2yadifa100-W3yadifa100-W4yadifa100-W5yadifa100-W6yadifa100-W7yadifa100-W8yadifa100-W9yadifa100-W10yadifa100-W11yadifa100-W12nsd3210-W1nsd3210-W2nsd3210-W3nsd3210-W4nsd3210-W5nsd3210-W6nsd3210-W7nsd3210-W8nsd3210-W9nsd3210-W10nsd3210-W11nsd3210-W12knot105-W1knot105-W2knot105-W3knot105-W4knot105-W5knot105-W6knot105-W7knot105-W8knot105-W9knot105-W10knot105-W11knot105-W12bind991-W1bind991-W2bind991-W3bind991-W4bind991-W5bind991-W6bind991-W7bind991-W8bind991-W9bind991-W10bind991-W11bind991-W1250k100k150k200k250k300k350k400k450kQueries per second050 000100 000150 000200 000250 000300 000350 000400 000450 000500 000Answers per second
Query ratesSetup: Ubuntu 12.04 using kernel 3.2.0 (Best results comparison) yadifa100-W0yadifa100-W1yadifa100-W2yadifa100-W3yadifa100-W4yadifa100-W5yadifa100-W6yadifa100-W7yadifa100-W8yadifa100-W9yadifa100-W10yadifa100-W11yadifa100-W12nsd3210-W1nsd3210-W2nsd3210-W3nsd3210-W4nsd3210-W5nsd3210-W6nsd3210-W7nsd3210-W8nsd3210-W9nsd3210-W10nsd3210-W11nsd3210-W12knot105-W1knot105-W2knot105-W3knot105-W4knot105-W5knot105-W6knot105-W7knot105-W8knot105-W9knot105-W10knot105-W11knot105-W12bind991-W1bind991-W2bind991-W3bind991-W4bind991-W5bind991-W6bind991-W7bind991-W8bind991-W9bind991-W10bind991-W11bind991-W1250k100k150k200k250k300k350k400k450kQueries per second050 000100 000150 000200 000250 000300 000350 000400 000450 000500 000Answers per second
Query ratesSetup: Ubuntu 12.04 using kernel 2.6.32 (Best results comparison)yadifa100-W0yadifa100-W1yadifa100-W2yadifa100-W3yadifa100-W4yadifa100-W5yadifa100-W6yadifa100-W7yadifa100-W8yadifa100-W9yadifa100-W10yadifa100-W11yadifa100-W12nsd3210-W1nsd3210-W2nsd3210-W3nsd3210-W4nsd3210-W5nsd3210-W6nsd3210-W7nsd3210-W8nsd3210-W9nsd3210-W10nsd3210-W11nsd3210-W12knot105-W1knot105-W2knot105-W3knot105-W4knot105-W5knot105-W6knot105-W7knot105-W8knot105-W9knot105-W10knot105-W11knot105-W12bind991P1-W1bind991P1-W2bind991P1-W3bind991P1-W4bind991P1-W5bind991P1-W6bind991P1-W7bind991P1-W8bind991P1-W9bind991P1-W10bind991P1-W11bind991P1-W1250k100k150k200k250k300k350k400k450k500k550kQueries per second0100 00025 00050 00075 000125 000150 000175 000Answers per second
Query ratesSetup: FreeBSD 8.2 (Best results comparison)yadifa100-W0yadifa100-W1yadifa100-W2yadifa100-W3yadifa100-W4yadifa100-W5yadifa100-W6yadifa100-W7yadifa100-W8yadifa100-W9yadifa100-W10yadifa100-W11yadifa100-W12nsd3210-W1nsd3210-W2nsd3210-W3nsd3210-W4nsd3210-W5nsd3210-W6nsd3210-W7nsd3210-W8nsd3210-W9nsd3210-W10nsd3210-W11nsd3210-W12knot105-W1knot105-W2knot105-W3knot105-W4knot105-W5knot105-W6knot105-W7knot105-W8knot105-W9knot105-W10knot105-W11knot105-W12bind991-W1bind991-W2bind991-W3bind991-W4bind991-W5bind991-W6bind991-W7bind991-W8bind991-W9bind991-W10bind991-W11bind991-W1250k100k150k200k250k300k350k400k450k500kQueries per second050 000100 000150 000200 000250 000300 000350 000400 000450 000500 000Answers per second